Getting Started with Prometheus and Grafana

I am on mission to build a devOps community, so please be part of it and connect with me over linkedin : https://www.linkedin.com/in/sunilkumar2807/
This post is broken up into 3 separate sections : “Introduction”, “Setting up Prometheus” and “Setting up Grafana For Prometheus”. The First section will concern the explanation of System Monitoring, Prometheus, and its different components. The second section will deal with the installation and the setup up part of Prometheus on Ubuntu 18.04. The last section will deal with the configuration and the integration of Grafana to Prometheus
Introduction
A system monitor is a hardware or software component used to monitor system resources and performance in a computer. Its main goal is to analyze the computer’s operation and performance, and to detect and alert about possible errors. Such systems give us the ability to find out what is happening on our machine at any given time. Whether it’s the percentage of system’s resources currently used, what commands are being run, or who is logged on.
Running complex applications on actual servers is complicated and things can go haywire for several reasons such as :
Disk Full : No new data can be store
Software Bug : Request Errors
High Temperature : Hardware Failure
Network Outage : Services cannot communicate
Low Memory Utilization : Money wasted
Being able to monitor the performance of your system is essential. If system resources become too low it can cause a lot of problems. The ability to know what is happening can help determine whether system upgrades are needed, or if some services need to be moved to another machine.
When a performance issue arises, there are 4 main areas to consider: CPU, Memory, Disk I/O, and Network. The ability to determine where the bottleneck is can save you a lot of time.
There are different ways in which you could do the monitoring but in our case , we’ll be using Prometheus.
What is Prometheus?
Prometheus is an open-source systems monitoring and alerting toolkit originally built at SoundCloud. Since its inception in 2012, many companies and organizations have adopted Prometheus, and the project has a very active developer and user community. It is now a standalone open source project and maintained independently of any company. To emphasize this, and to clarify the project’s governance structure, Prometheus joined the Cloud Native Computing Foundation in 2016 as the second hosted project, after Kubernetes.
Prometheus doesn’t use protocols such as SMNP or some sort of agent service. Instead, it pulls (scrapes) metrics from a client (target) over http and places the data into its local time series database that you can query using its own DSL.
Prometheus uses exporters that are installed and configured on the clients in order to convert and expose their metrics in a Prometheus format. The Prometheus server then scrapes the exporter for metrics.
By default Prometheus comes with a UI that can be accessed on port 9090 on the Prometheus server. Users also have the ability to build dashboards and integrate their favorite visualization software, such as Grafana.
Prometheus uses a separate component for alerting called the AlertManager. The AlertManager receives metrics from the Prometheus server and then is responsible for grouping and making sense of the metrics and then forwarding an alert to your chosen notification system. The AlertManager currently supports email, Slack, VictorOps, HipChat, WebHooks and many more.
Let’s recap some of the important terms :
Prometheus Server : The main server that scrapes and stores the scraped metrics in a time series DB.
Scrape : Prometheus server uses a pulling method to retrieve metrics.
Target : The Prometheus servers clients that it retrieves info from.
Exporter : Target libraries that convert and export existing metrics into Prometheus format.
Alert Manager : Component responsible for handling alerts.
Here is an image of an overview of the Prometheus architecture.
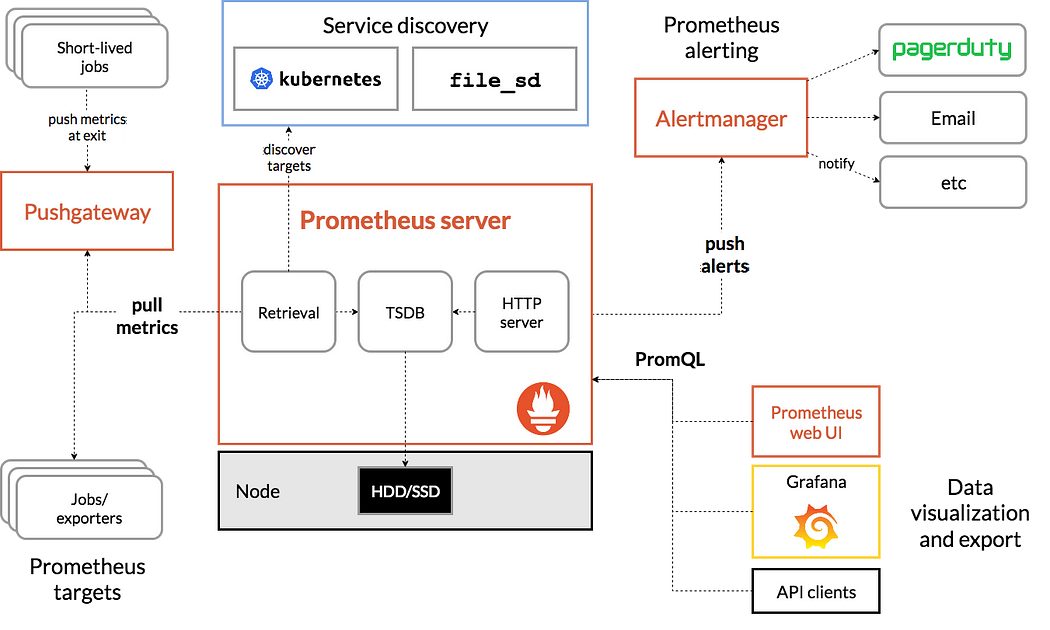
Prometheus scrapes metrics from exports, stores them in the TSDB on the Prometheus server and then pushes alerts to Alertmanager.
The Service discovery component is a feature that allows Prometheus to auto discover different targets since these targets will come and go so frequently in a distributed system or microservice orchestration style of architecture. We will not be responsible for continuously updating a static list of target addresses each time a service and/or a piece of infrastructure is removed or added. Prometheus will automatically discover and start/stop scraping for us.
Before moving to the next section , i want to provide a list of resources that I have found helpful while trying to learn Prometheus :
Create a Prometheus Monitoring Server with a Grafana Dashboard
Configure a Prometheus Monitoring Server with a Grafana Dashboard
Setting up Prometheus
Now that we have the basic understanding of Prometheus,let’s get a Prometheus server up and start scraping some metrics. For this example I’ll set up the following architecture on Ubuntu 18.04

Installing node_exporter
First, we will download the Node Exporter on all machines :
wget https://github.com/prometheus/node_exporter/releases/download/v0.15.2/node_exporter-0.15.2.linux-amd64.tar.gz
Extract the downloaded archive
tar -xf node_exporter-0.15.2.linux-amd64.tar.gz
Move the node_exporter binary to /usr/local/bin:
sudo mv node_exporter-0.15.2.linux-amd64/node_exporter /usr/local/bin
Remove the residual files with:
rm -r node_exporter-0.15.2.linux-amd64*
Next,we will create users and service files for node_exporter.
For security reasons, it is always recommended to run any services/daemons in separate accounts of their own. Thus, we are going to create an user account for node_exporter. We have used the
-rflag to indicate it is a system account, and set the default shell to/bin/falseusing-sto prevent logins.
sudo useradd -rs /bin/false node_exporter
Then, we will create a systemd unit file so that node_exporter can be started at boot. sudo nano /etc/systemd/system/node_exporter.service
[Unit]
Description=Node Exporter
After=network.target

[Service]
User=node_exporter
Group=node_exporter
Type=simple
ExecStart=/usr/local/bin/node_exporter

[Install]
WantedBy=multi-user.target
Since we have created a new unit file, we must reload the systemd daemon, set the service to always run at boot and start it :
sudo systemctl daemon-reload
sudo systemctl enable node_exporter
sudo systemctl start node_exporter
Installing Prometheus
The next step is to download and install Prometheus only on the Prometheus Server.
wget https://github.com/prometheus/prometheus/releases/download/v2.1.0/prometheus-2.1.0.linux-amd64.tar.gz
Extract the Prometheus archive :
tar -xf prometheus-2.1.0.linux-amd64.tar.gz
Move the binaries to /usr/local/bin:
sudo mv prometheus-2.1.0.linux-amd64/prometheus prometheus-2.1.0.linux-amd64/promtool /usr/local/bin
Now, we need to create directories for configuration files and other prometheus data.
sudo mkdir /etc/prometheus /var/lib/prometheus
Then, we move the configuration files to the directory we made previously:
sudo mv prometheus-2.1.0.linux-amd64/consoles prometheus-2.1.0.linux-amd64/console_libraries /etc/prometheus
Finally, we can delete the leftover files as we do not need them any more:
rm -r prometheus-2.1.0.linux-amd64*
Configuring Prometheus
After having installed Prometheus, we have to configure Prometheus to let it know about the HTTP endpoints it should monitor. Prometheus uses the YAML format for its configuration.
Go to /etc/hosts and add the following lines, replace x.x.x.x with the machine’s corresponding IP address
x.x.x.x prometheus-target-1
x.x.x.x prometheus-target-2
We will use /etc/prometheus/prometheus.yml as our configuration file
global:
  scrape_interval: 10s

scrape_configs:
  - job_name: 'prometheus_metrics'
    scrape_interval: 5s
    static_configs:
      - targets: ['localhost:9090']
  - job_name: 'node_exporter_metrics'
    scrape_interval: 5s
    static_configs:
      - targets: ['localhost:9100','prometheus-target-1:9100','prometheus-target-2:9100']
In this file, we have defined a default scraping interval of 10 seconds. We have also define two sources of metrics, named prometheus_metrics and node_exporter_metrics. For both of them, we have set the scraping interval to 5 seconds, overriding the default. Then, we have specified the locations where these metrics will be available. Prometheus uses port 9090 and node_exporter uses port 9100 to provide their metrics.
Finally, we will also change the ownership of files that Prometheus will use:
sudo useradd -rs /bin/false prometheussudo chown -R prometheus: /etc/prometheus /var/lib/prometheus
Then, we will create a systemd unit file in /etc/systemd/system/prometheus.service with the following contents :
[Unit]
Description=Prometheus
After=network.target

[Service]
User=prometheus
Group=prometheus
Type=simple
ExecStart=/usr/local/bin/prometheus \
    --config.file /etc/prometheus/prometheus.yml \
    --storage.tsdb.path /var/lib/prometheus/ \
    --web.console.templates=/etc/prometheus/consoles \
    --web.console.libraries=/etc/prometheus/console_libraries

[Install]
WantedBy=multi-user.target
Finally, we will reload systemd:
sudo systemctl daemon-reload
sudo systemctl enable prometheus
sudo systemctl start prometheus
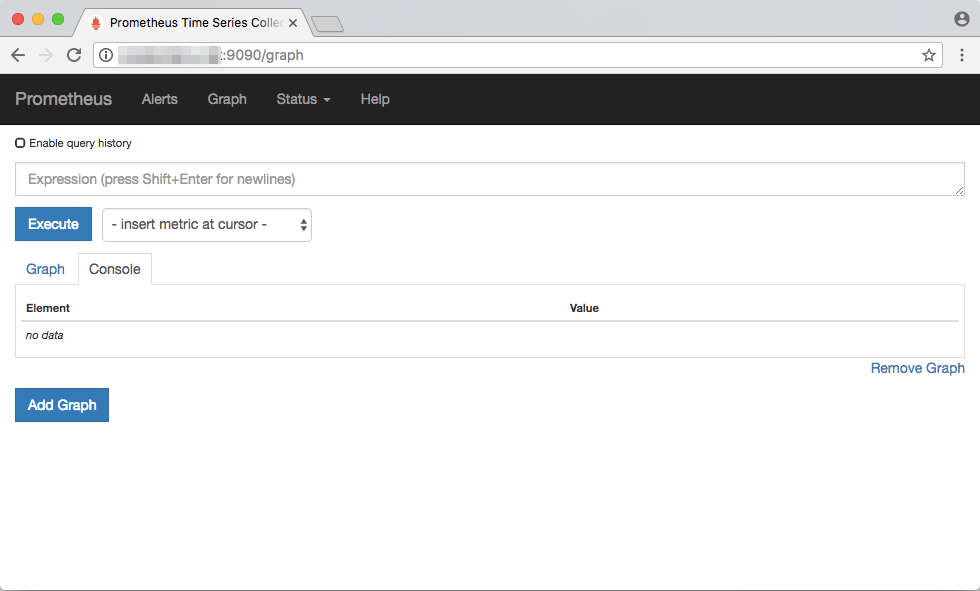
Prometheus provides a web UI for running basic queries located at http://<your_server_IP>:9090/. This is how it looks like in a web browser:
Setting up Grafana For Prometheus
First, Install Grafana on our instance which queries our Prometheus server.
wget https://s3-us-west-2.amazonaws.com/grafana-releases/release/grafana_5.0.4_amd64.deb
sudo apt-get install -y adduser libfontconfig
sudo dpkg -i grafana_5.0.4_amd64.deb
Then, Enable the automatic start of Grafana by systemd:
sudo systemctl daemon-reload && sudo systemctl enable grafana-server && sudo systemctl start grafana-server.service
Grafana is running now, and we can connect to it at http://your.server.ip:3000. The default user and password is admin / admin.
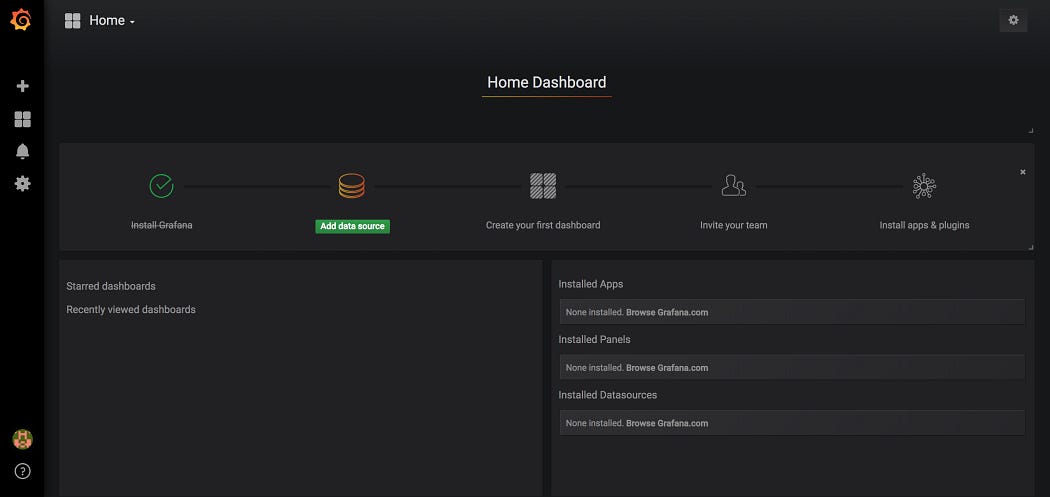
Now you have to create a Prometheus data source:
Click on the Grafana logo to open the sidebar.
Click on “Data Sources” in the sidebar.
Choose “Add New”.
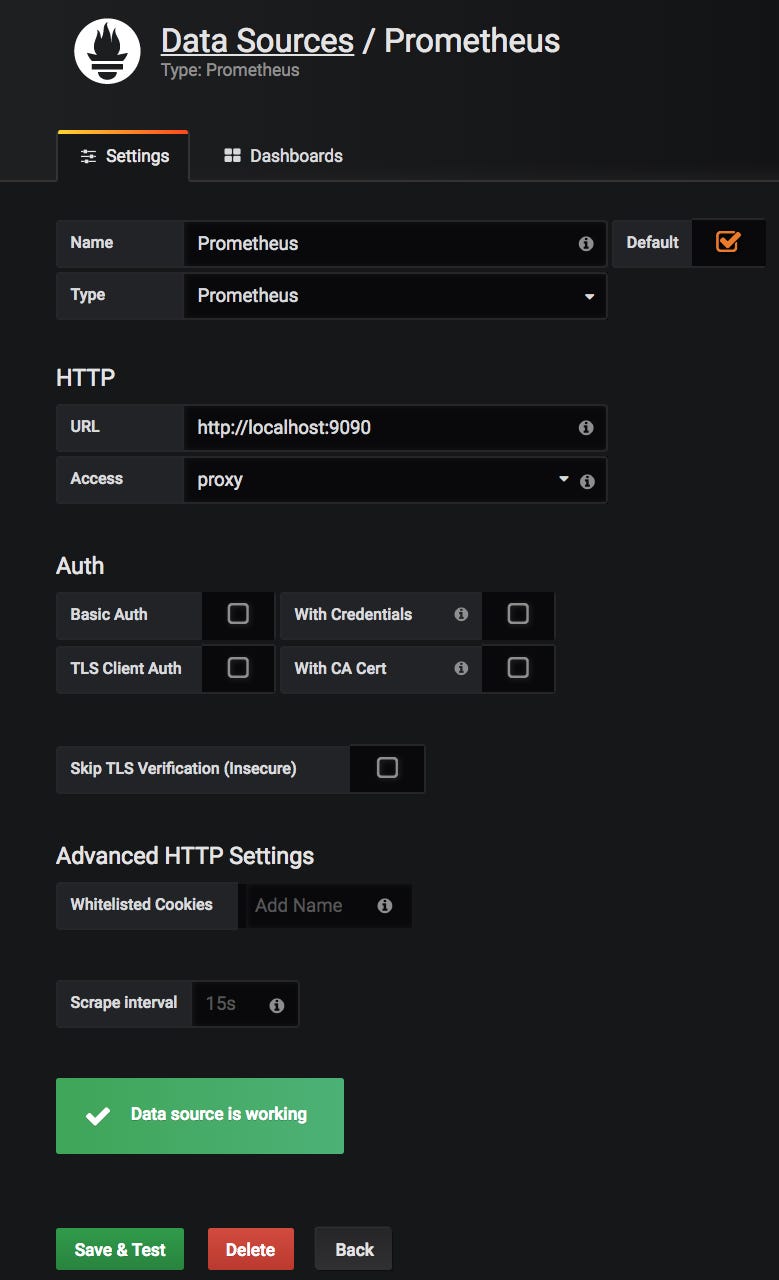
Select “Prometheus” as the data source.
Set the Prometheus server URL (in our case: http://localhost:9090/))
Click “Add” to test the connection and to save the new data source.
Your settings should look like this:
You are now ready to create your first dashboard from the information collected by Prometheus. You can also import some dashboards from a collection of shared dashboards
In this tutorial, we were able to configure a Prometheus server which provides the data to build Dashboards with Grafana. Don’t hesitate to consult the official documentation of Prometheus and Grafana.
If you’re interested about alerting using Prometheus along with AlertManager then checkout my next article .
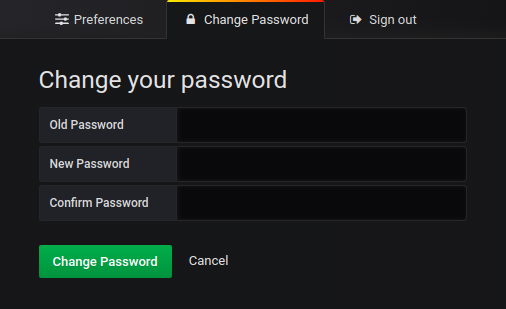
How to change Grafana’s default Username and Password
or access your Grafana interface and click on the icon at the buttom :

How to make your Grafana’s Dashboard as your Home Dashboard:
Access your dashboard and mark it as favorite.
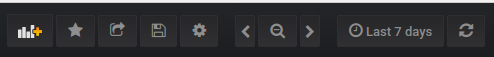
Then, go to preferences and select your dashboard as Home Dashboard.

I am Sunil kumar, Please do follow me here and support #devOps #trainwithshubham #github #devopscommunity #devops #cloud #devoparticles #trainwithshubham
Connect with me over linkedin : linkedin.com/in/sunilkumar2807


