Visualizing data is indeed a very useful and meaningful thing, and choosing a good tool for completing data visualization is also very important. Today I will introduce Grafana, an easy-to-use and adaptable data visualization tool. And recommended a best Raspberry Pi and screen integrated device compatible with Grafana. Hope it will help you to start using Grafana for data visualization.
What is Grafana?
Grafana is a professional cross-platform open-source data visualization and metric analysis tool developed by Grafana Labs. Grafaba allows users to query, visualize, alert, and understand metrics from multiple data sources. No matter where the data is or what type of database, Grafana can be perfectly matched.
How does Grafana work?
Let’s briefly understand the typical structure of Grafana infrastructure. You can better understand how Grafana works by explaining this part of the infrastructure.
The Grafana infrastructure can be divided into three parts: data producer, data source, and Grafana dashboard.
The data producer generates the data that needs to be visualized, which may come from the integrated server Jenkin, virtual machine, Raspberry Pi, or sensors in various application scenarios. The data source is a database that aggregates data produced by data producers. The data source may come from Prometheus, AWS, Influx DB, etc., and the database is connected to the data producer. Depending on the type of database, the data source pulls data from the data producer, or the data producer is configured to push data to the database. The data actually visualized depends on the data source. Grafana is the front end to actually visualize the data, to get the data, Grafana queries the data source and the data source returns the requested data according to the query, and then this data is displayed on the Grafana dashboard.
What can be done using Grafana?
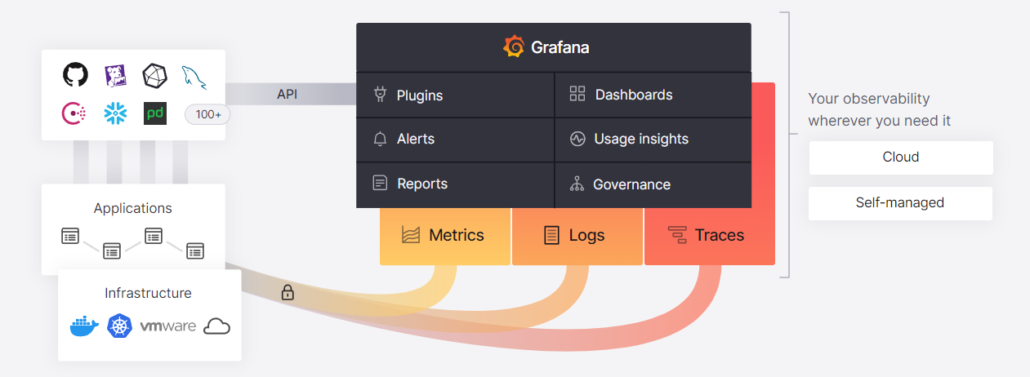
Image attribution:grafana.com
As the picture above shows, Grafana can render external data source data via API plugins, a process that does not require data migration or ingestion.
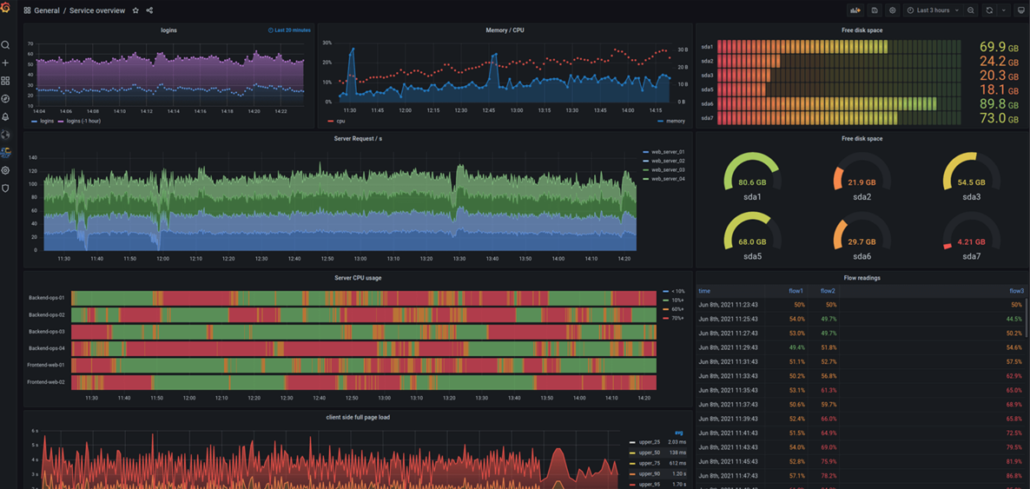
-Data visualization. You can visualize your data using the appropriate ones in a variety of dynamic Grafana dashboards. It features fast and flexible client-side graphics that make data presentations clear and beautiful.
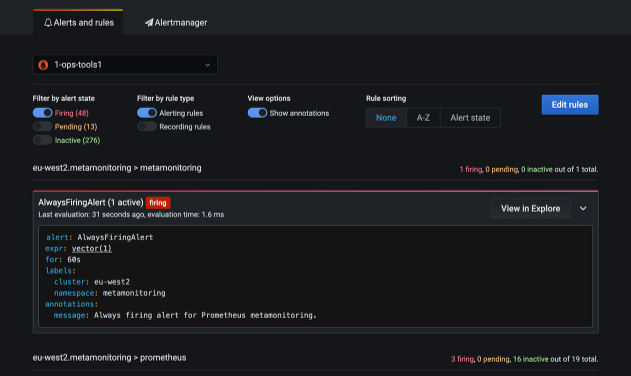
-Data Alerts & Notifications. You can create and manage data anomalies in the Alerts and Rules section. When data alerts occur, Grafana will continuously monitor the assessment and issue notifications. This will more efficiently manage the items you monitor.
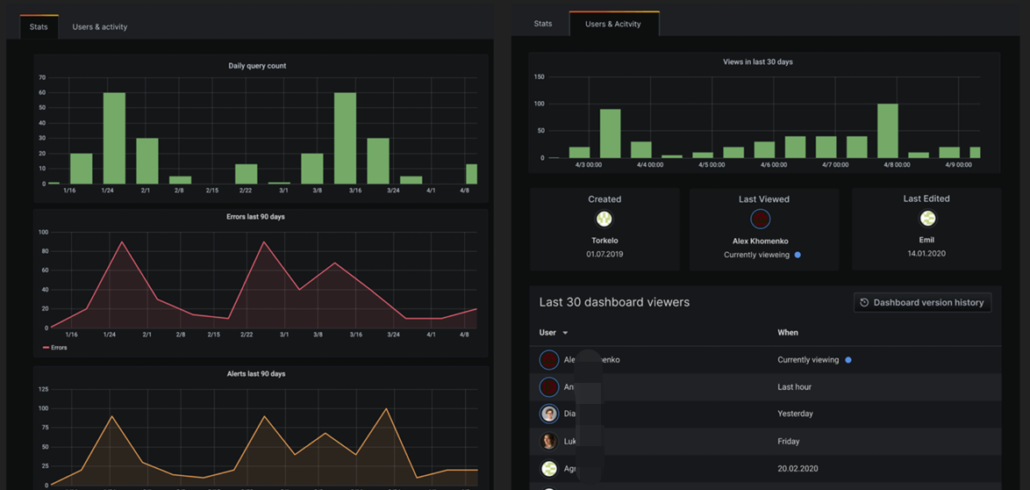
-Use insights. Data and dashboard information in Grafana can be shared among team members. Data begins to flow, and the value behind the data is constantly being mined driven by the data.
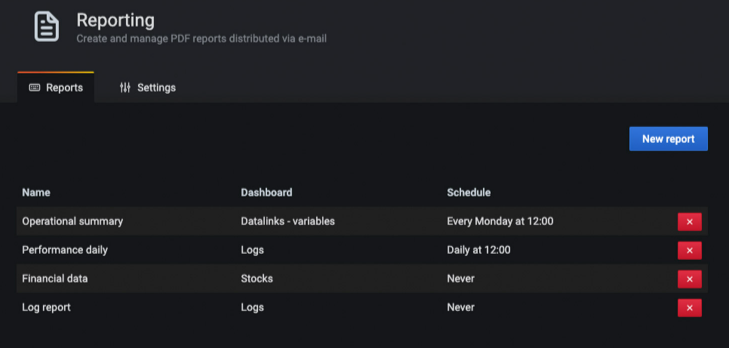
-PDF Reports Export & Transmission. The generated visualization data can be exported as a report in PDF format and can be sent to those who need it by Email.
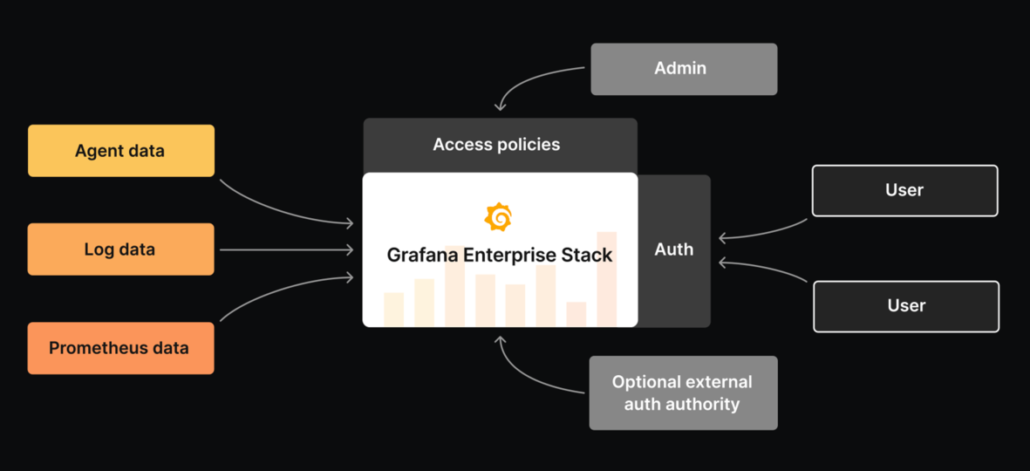
-Efficient governance. Use advanced data management tools to manage data from multiple data sources, making user permissions and data more clear and secure.
Why use Grafana?
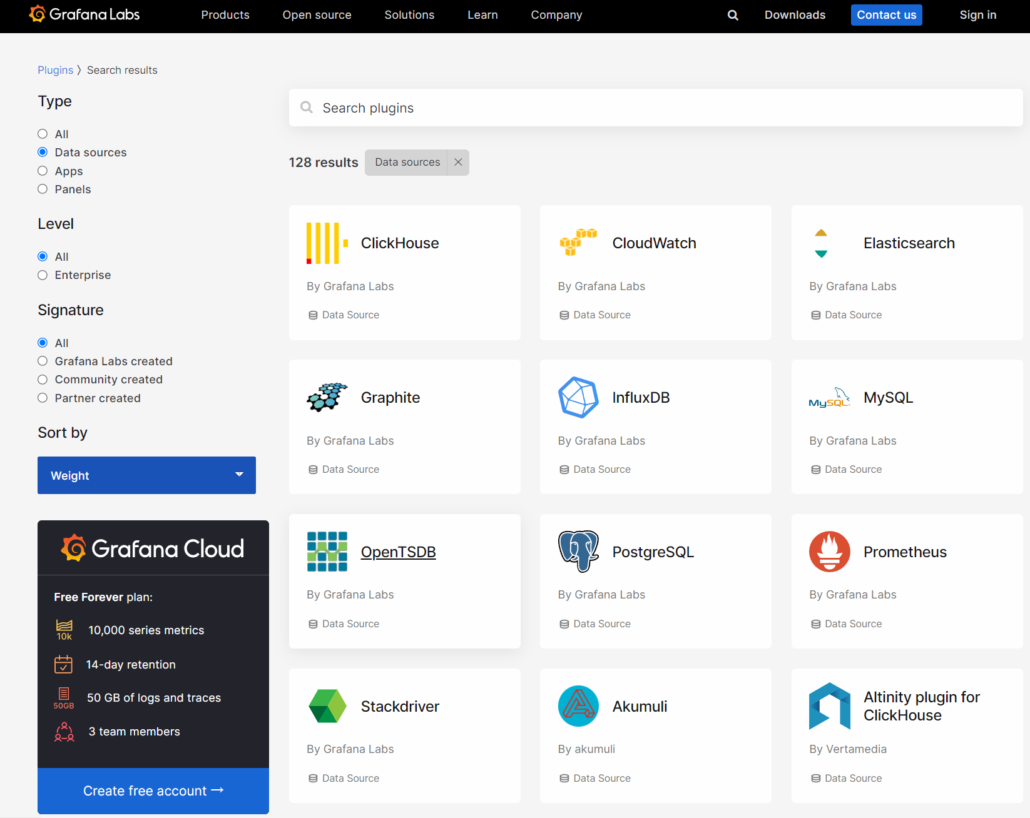
Grafana has a wide range of data visualization techniques, rich dashboard building, and a wide range of supported data source types. For example, commonly used database types AWS, Prometheus, Elasticsearch, Influx DB, MySQL, etc.
There are more than 100 data source plugins supported by Grafana, which can basically cover all types of data sources created. So it can be used as a general visualization tool.
Grafana supports a large number of visual charts, and various types of data visualization panel plug-ins are available. And if these cannot meet your needs, you can support secondary development to customize your own plug-ins.
I am Sunil kumar, Please do follow me here and support #devOps #trainwithshubham #github #devopscommunity #devops #cloud #devoparticles #trainwithshubham
Connect with me over linkedin : linkedin.com/in/sunilkumar2807
